Hello, welcome to Shandong Wantong Hydraulic Co., Ltd.!


Wantong Hydraulics: Net profit increased by 37.02% year-on-year in 2024. A dividend of 5 yuan per 10 shares is proposed.
Release time:
2025-03-13
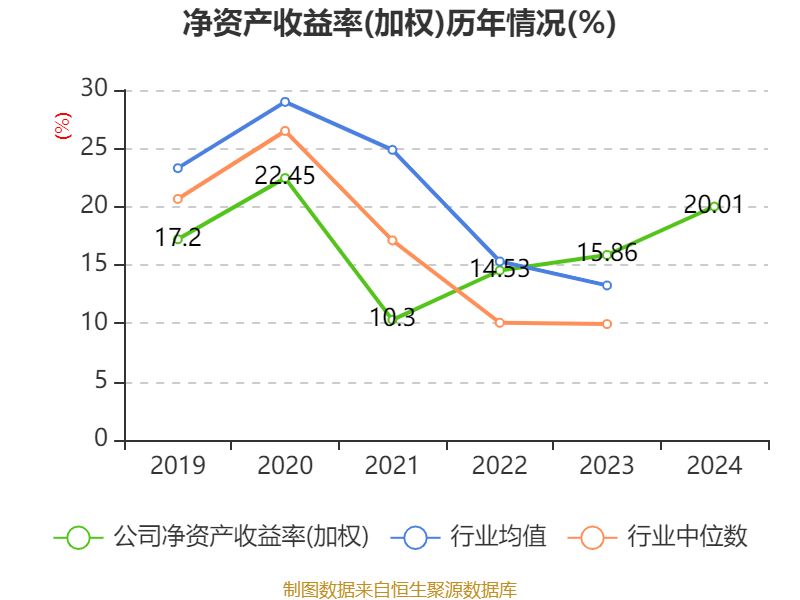
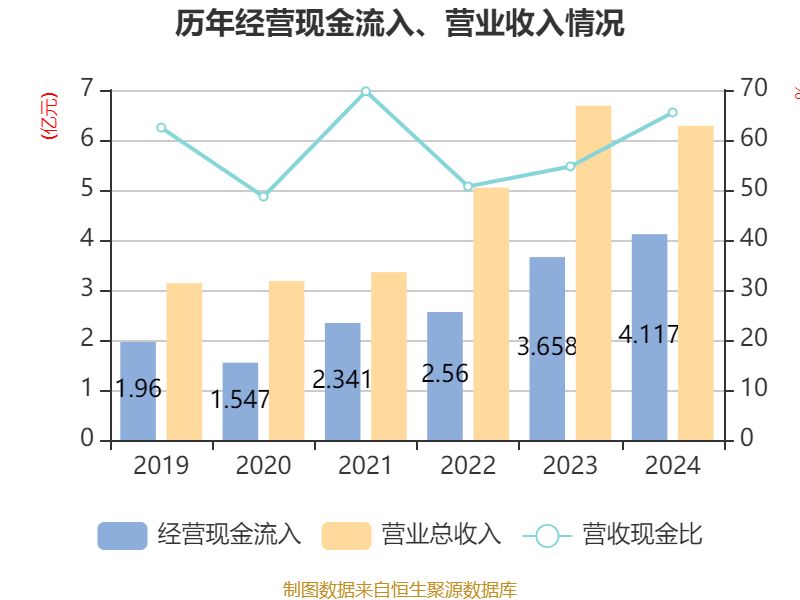
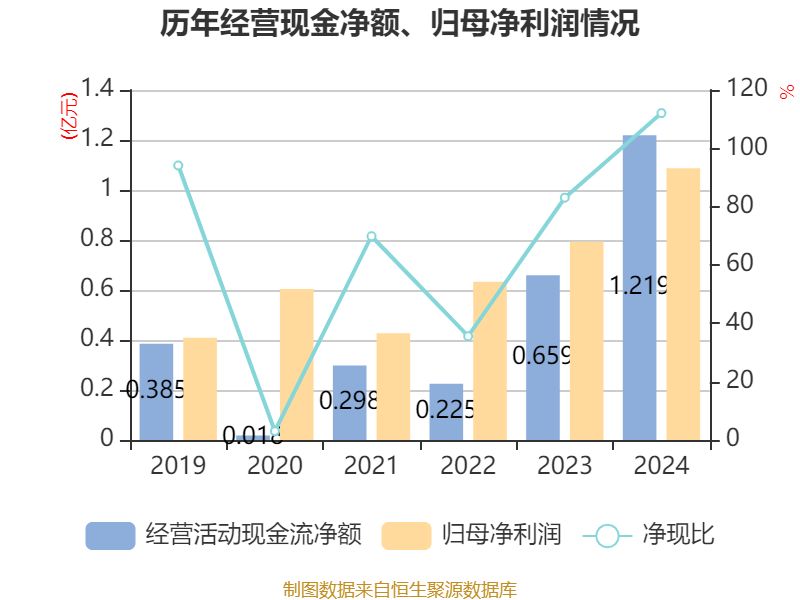
China Securities Journal Intelligent Financial InformationWantong Hydraulic(830839) disclosed its 2024 annual report on March 12. In 2024, the company achieved total operating revenue of 629 million yuan, a year-on-year decrease of 5.99%; net profit attributable to the parent company was 109 million yuan, a year-on-year increase of 37.02%; net profit excluding non-recurring gains and losses was 101 million yuan, a year-on-year increase of 35.11%; net cash flow from operating activities was 122 million yuan, a year-on-year increase of 84.85%; during the reporting period,Wantong Hydraulicbasic earnings per share were 0.9229 yuan, and the weighted average return on net assets was 20.01%. The company's 2024 annual distribution plan is: it is proposed to pay 5 yuan (including tax) per 10 shares to all shareholders.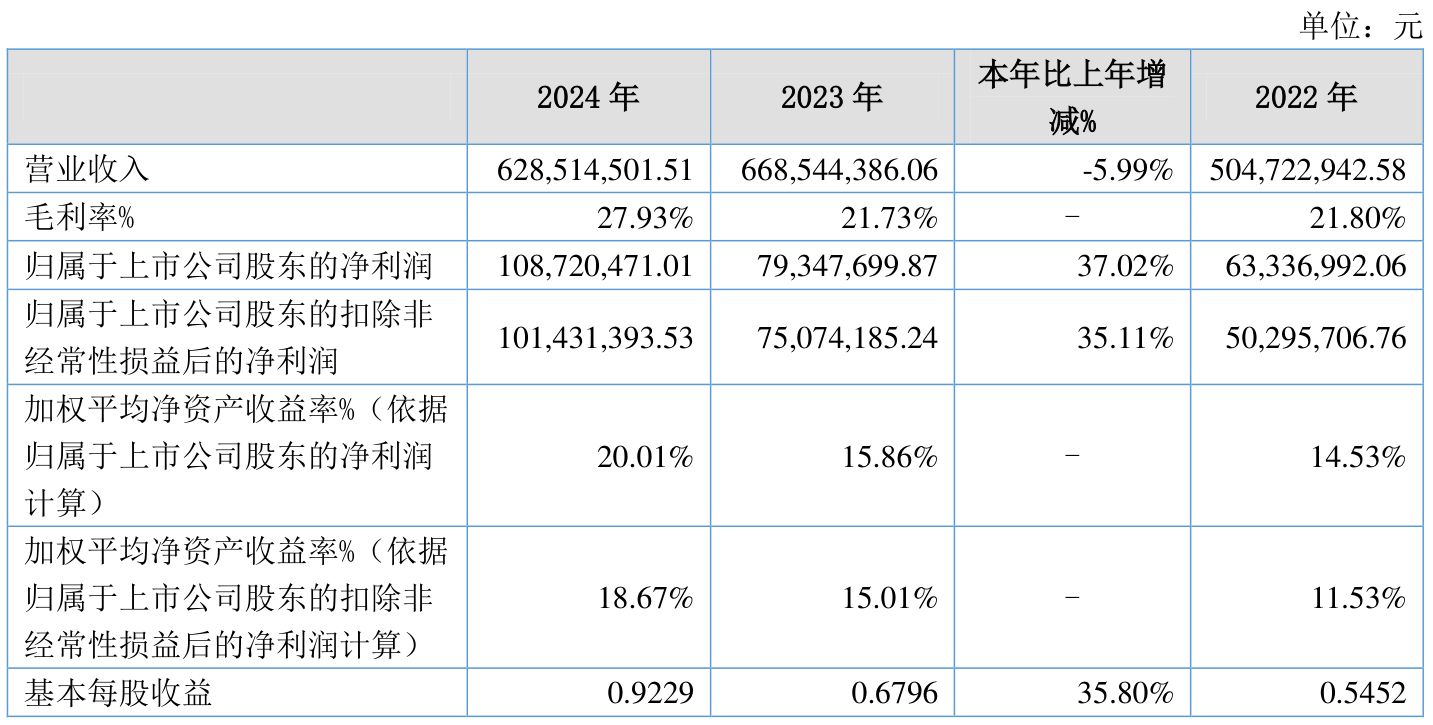
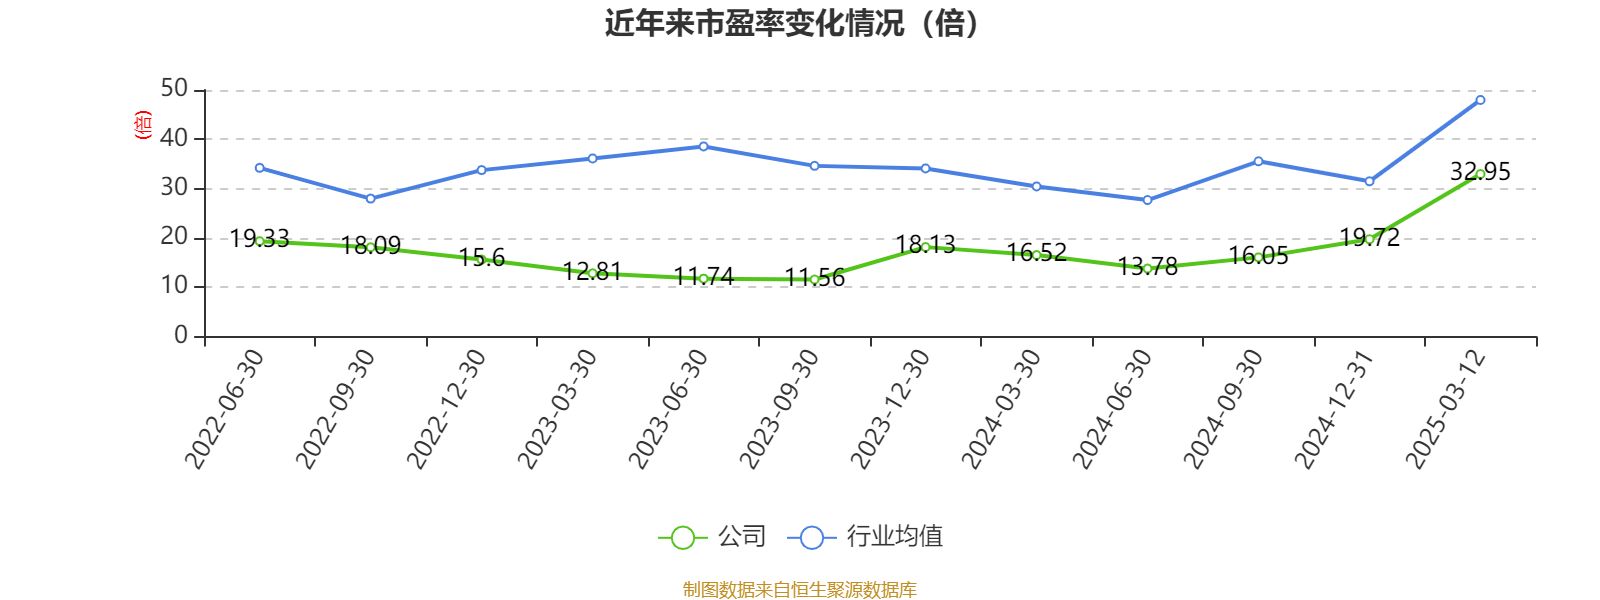
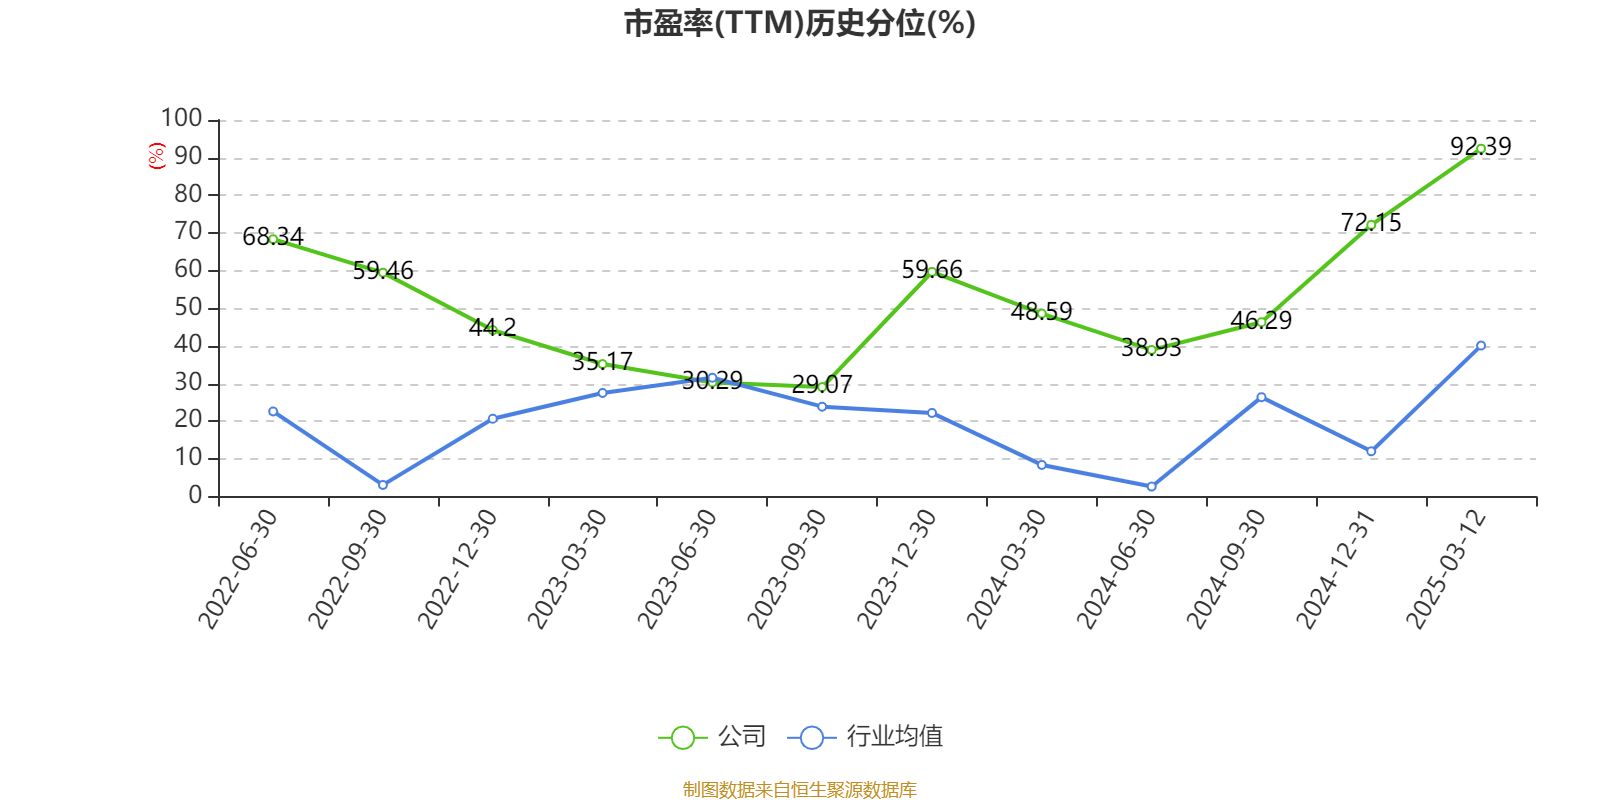
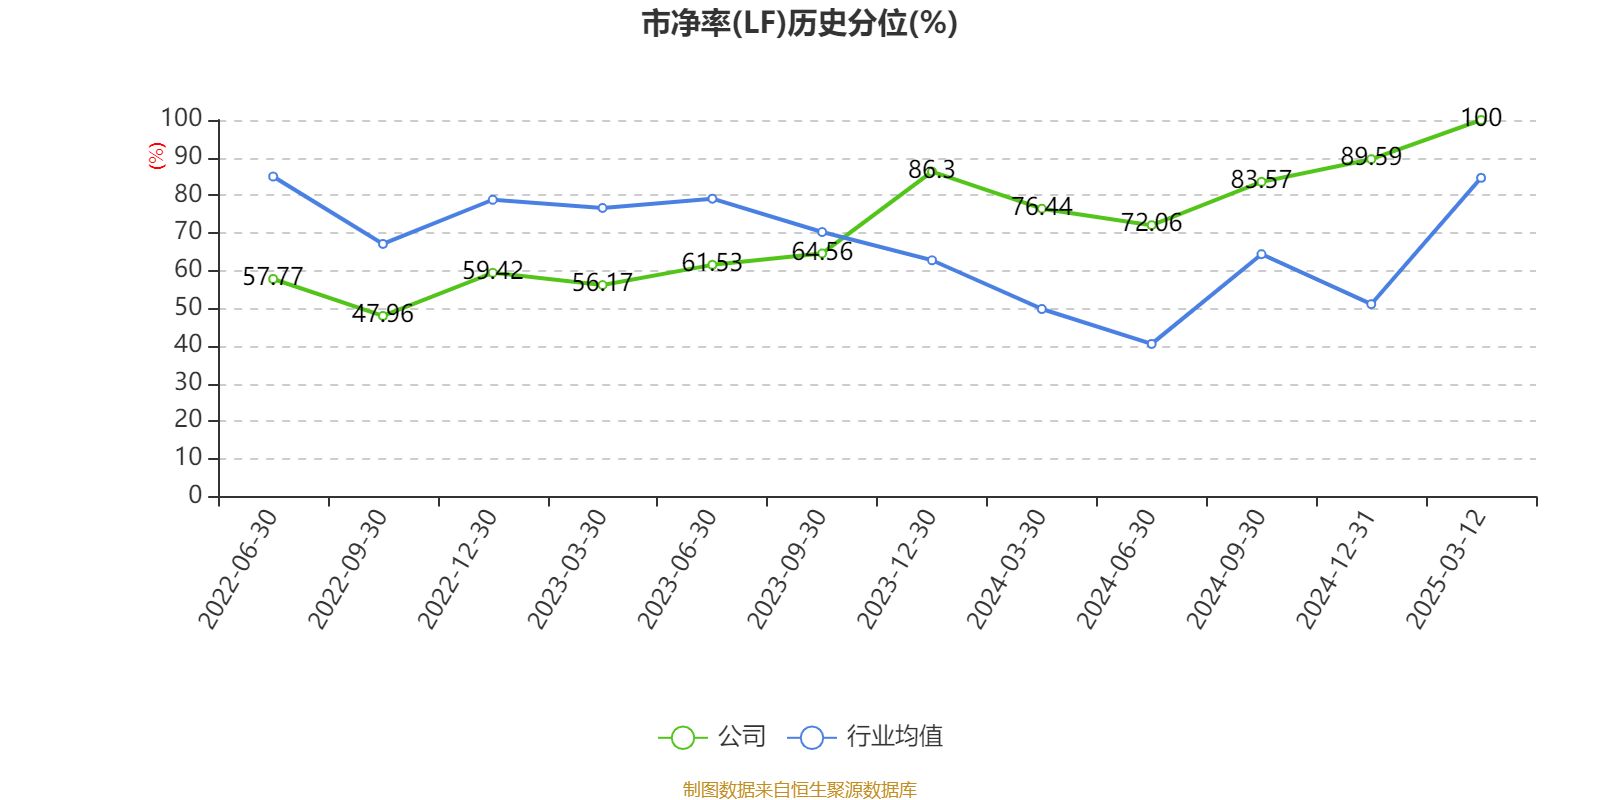
Calculated based on the closing price on March 12,Wantong Hydraulicthe current price-to-earnings ratio (TTM) is approximately 32.95 times, the price-to-book ratio (LF) is approximately 6.14 times, and the price-to-sales ratio (TTM) is approximately 5.7 times.
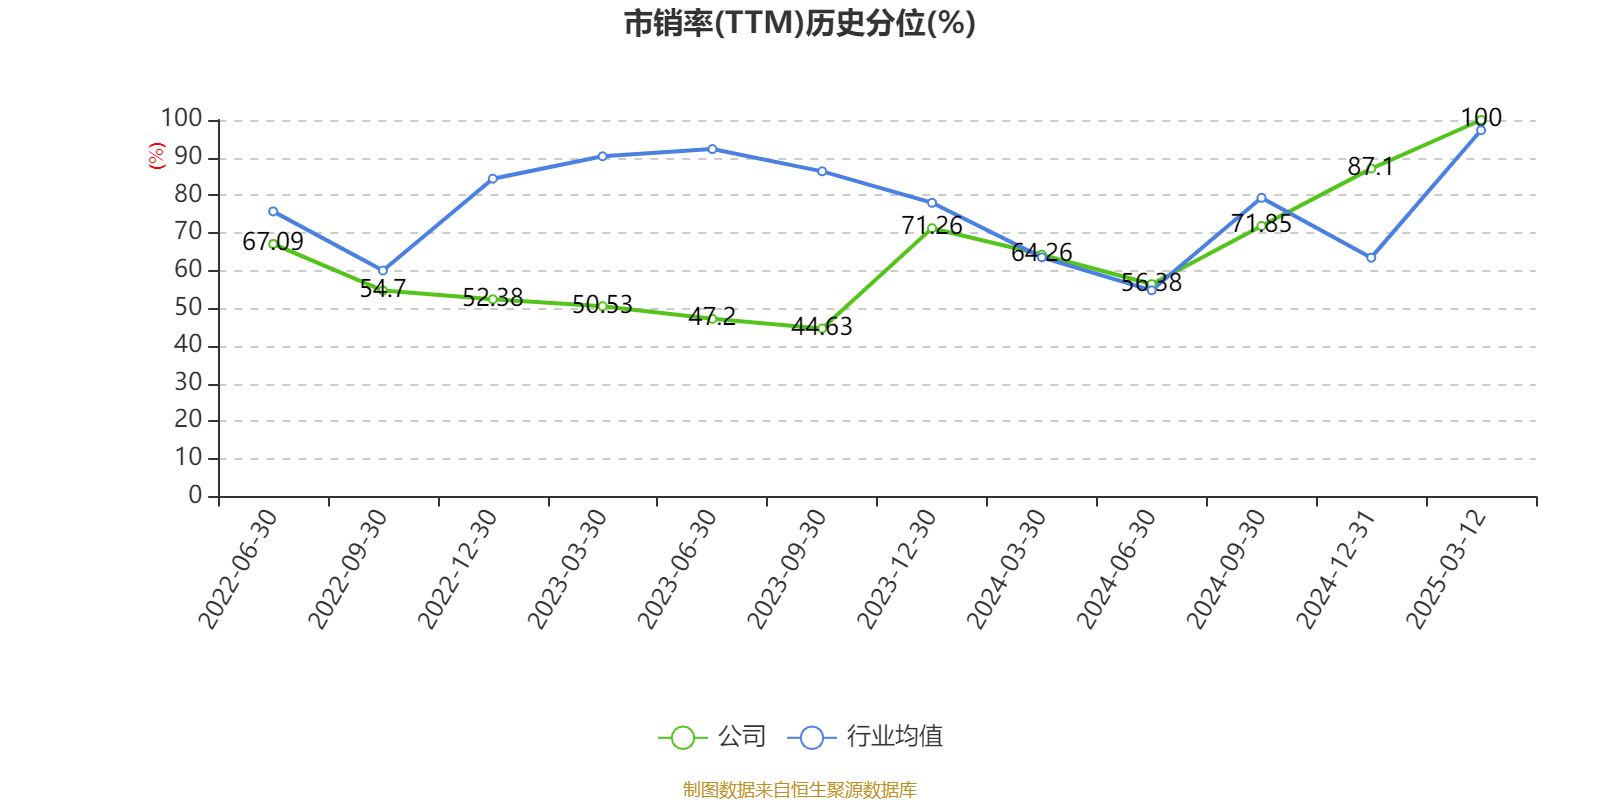
According to the data, the company mainly engages in the research and development, production, and sales of hydraulic products.
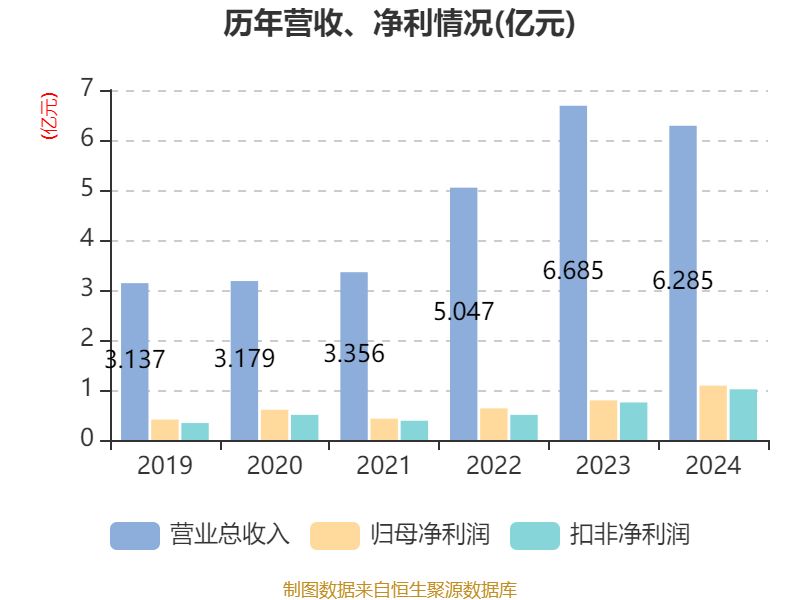
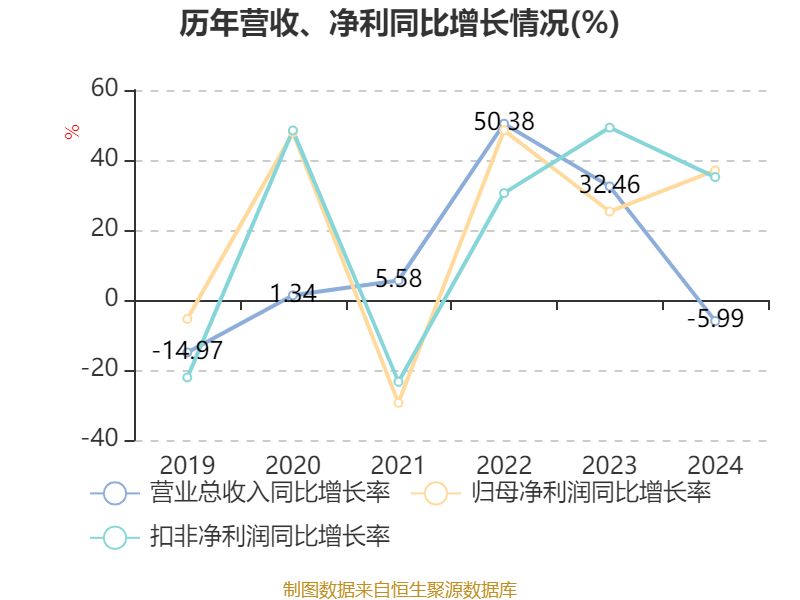
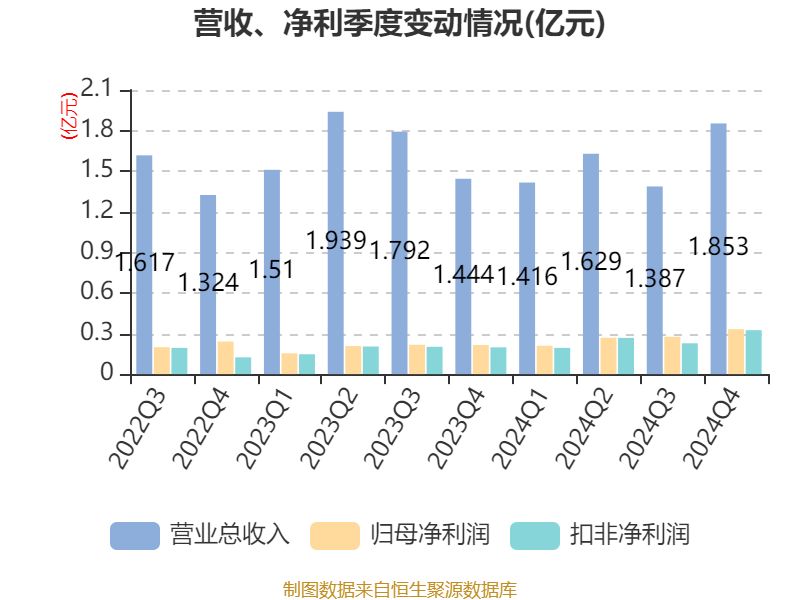
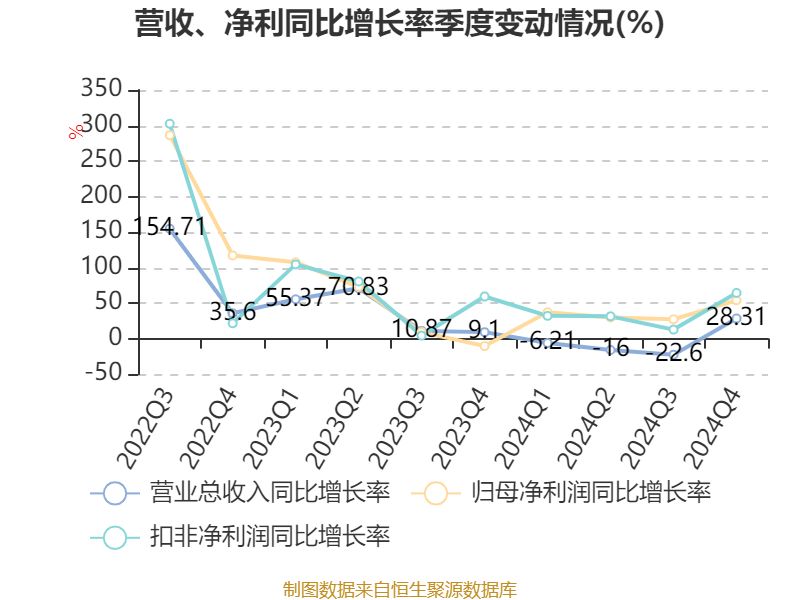
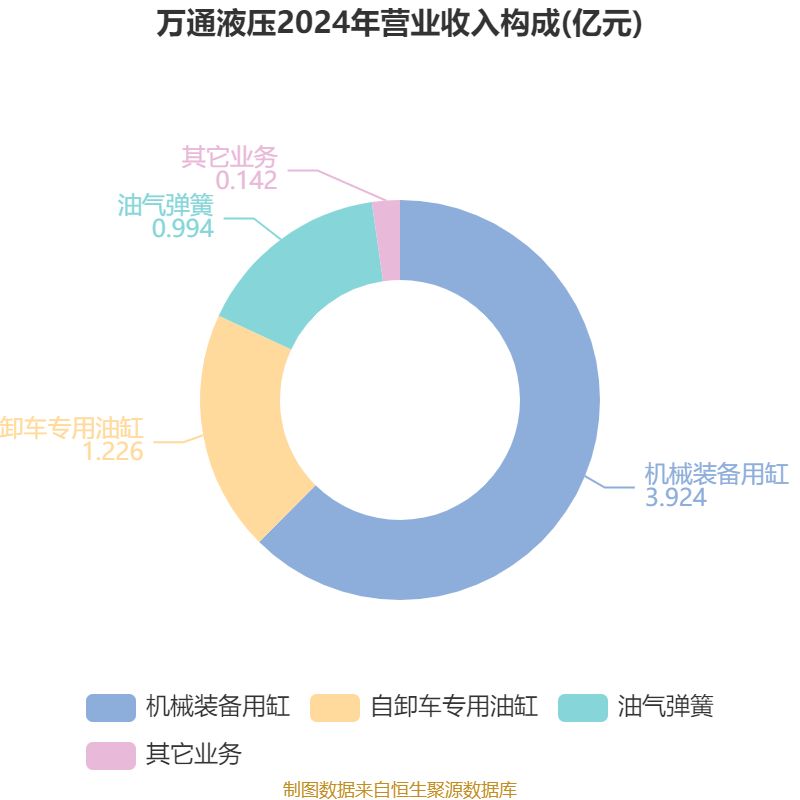
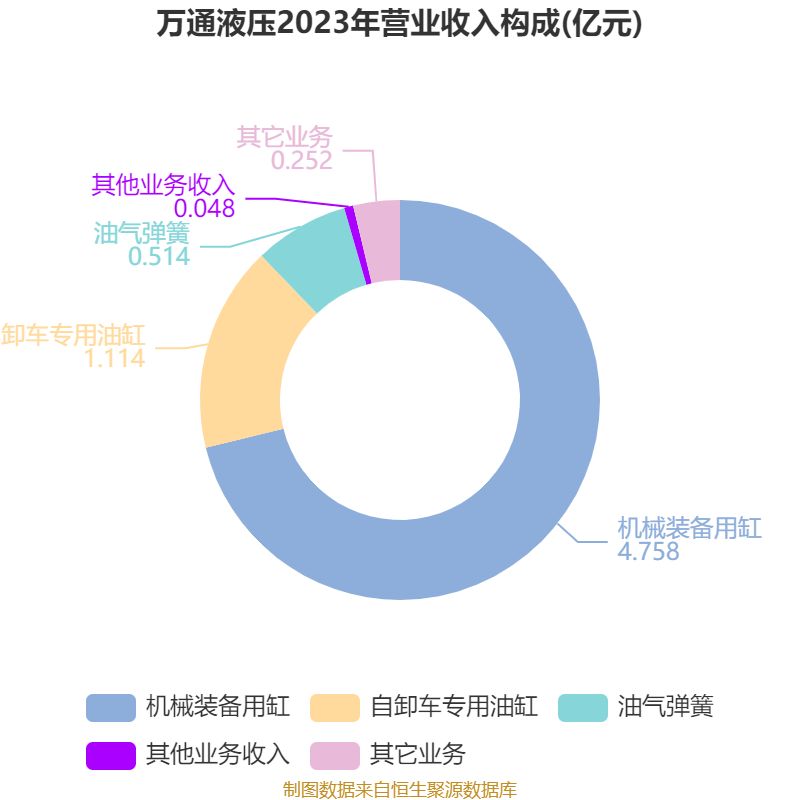
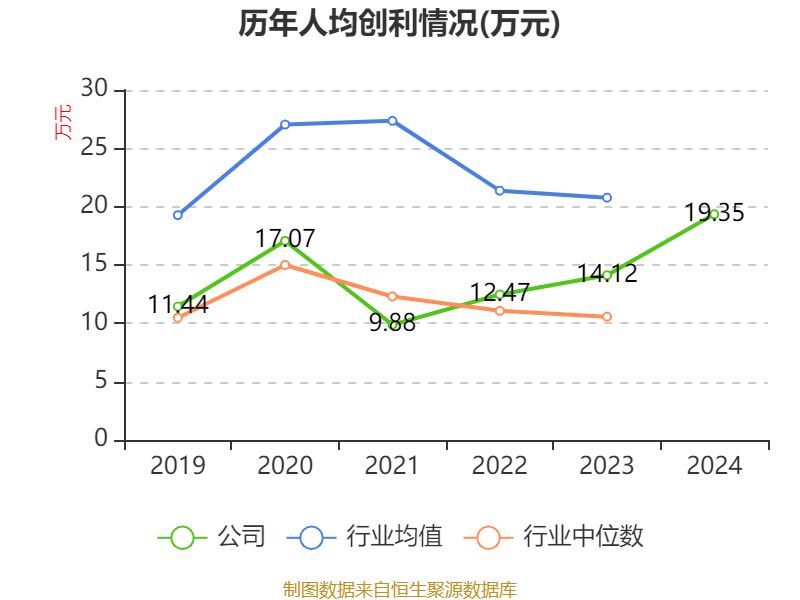
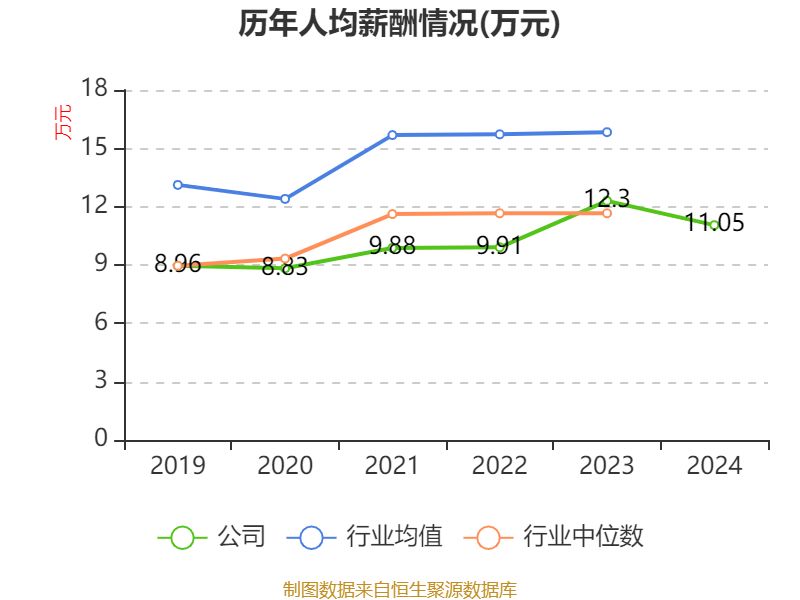
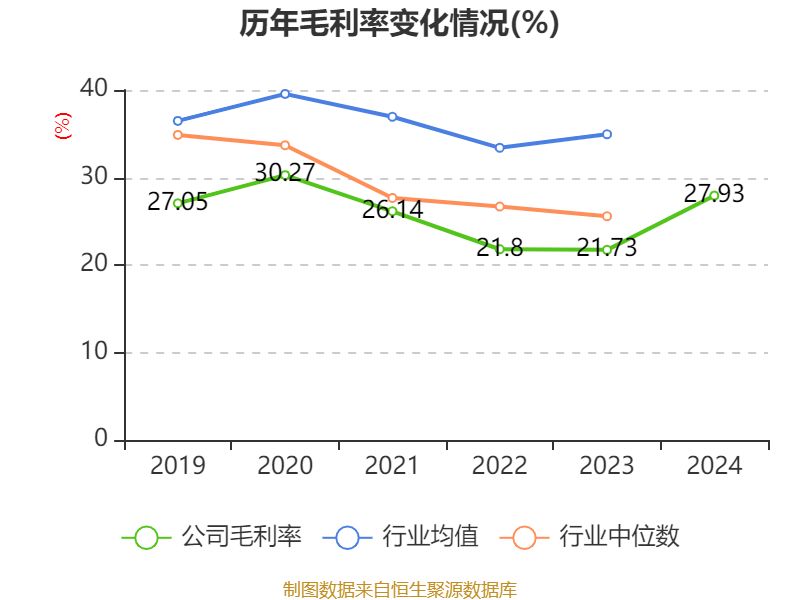
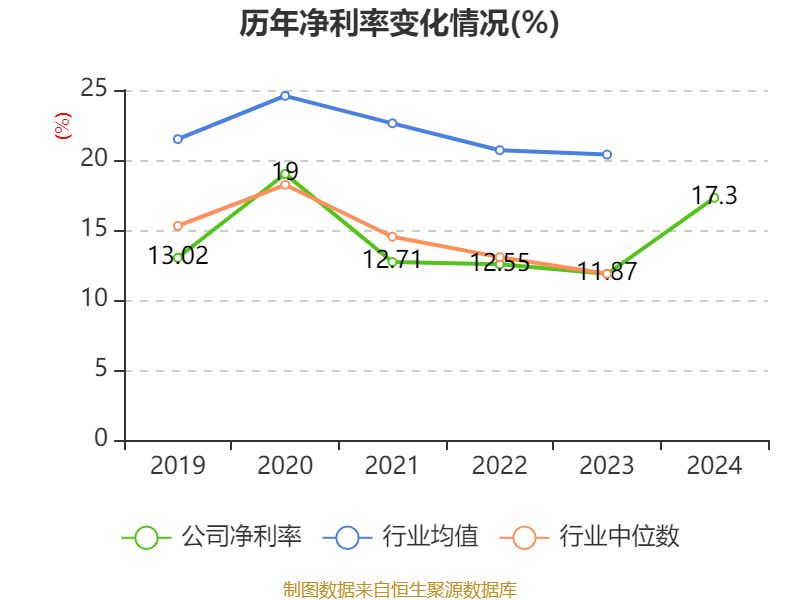
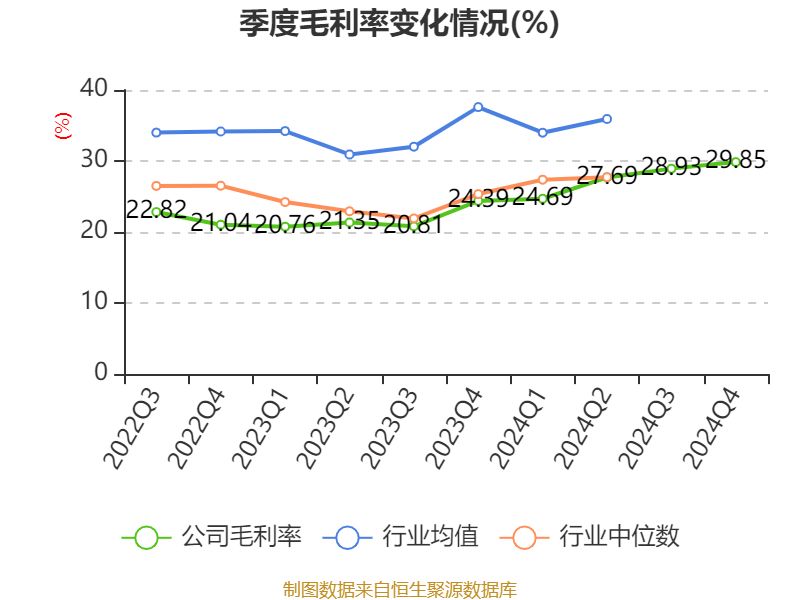
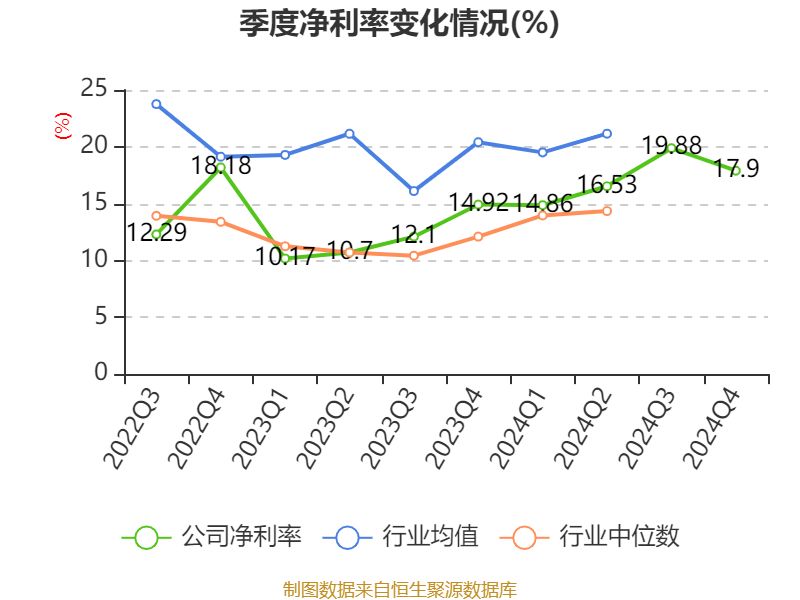
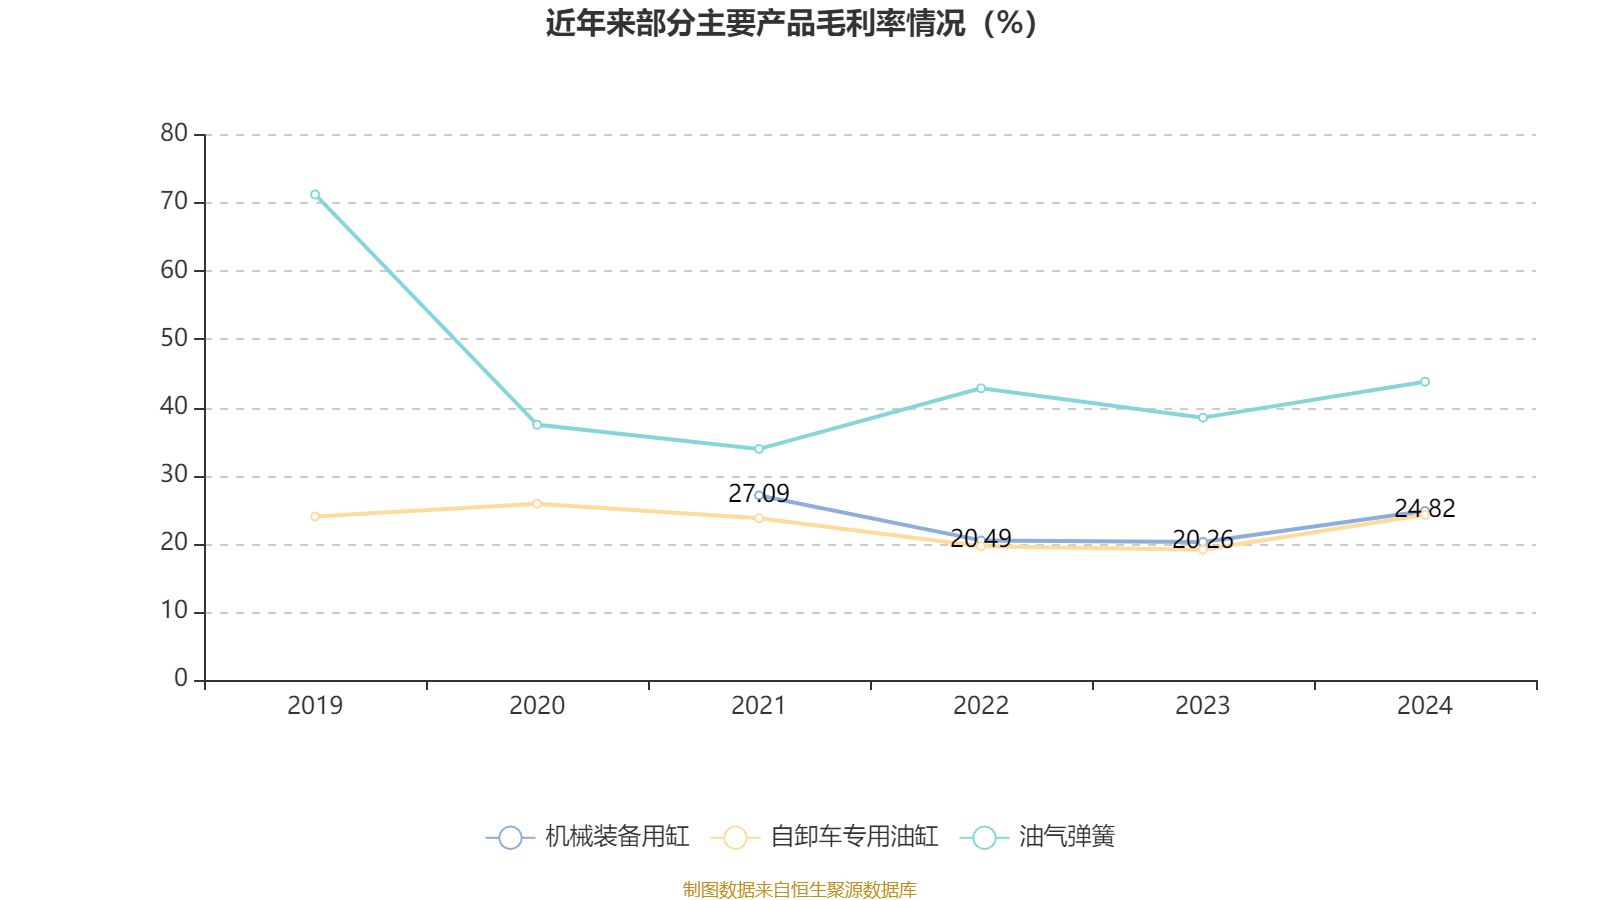
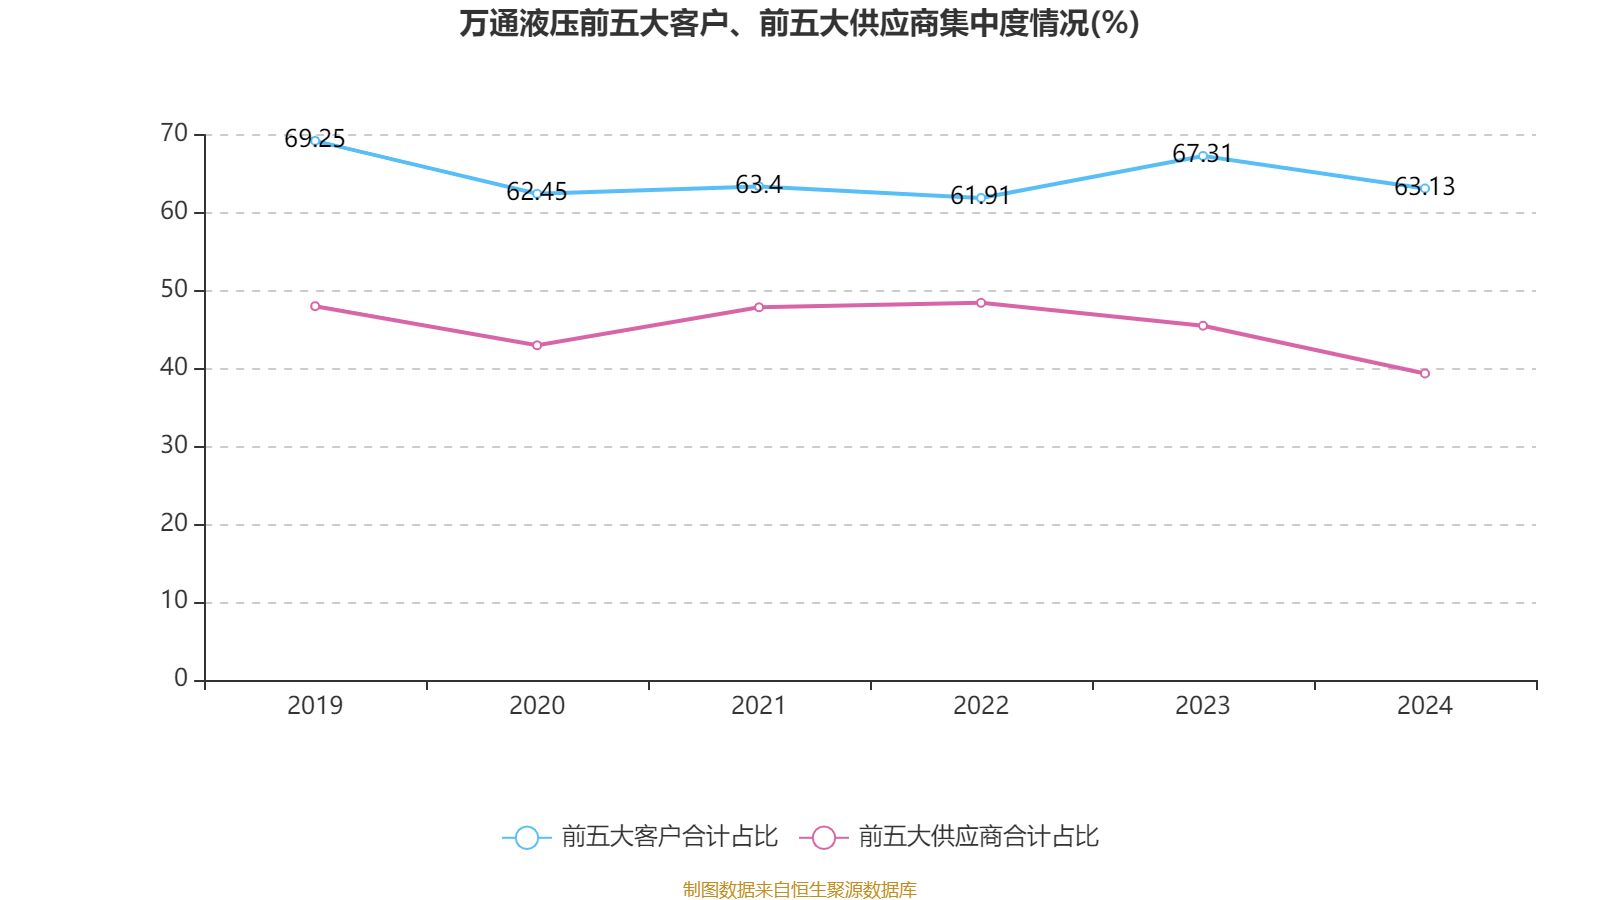
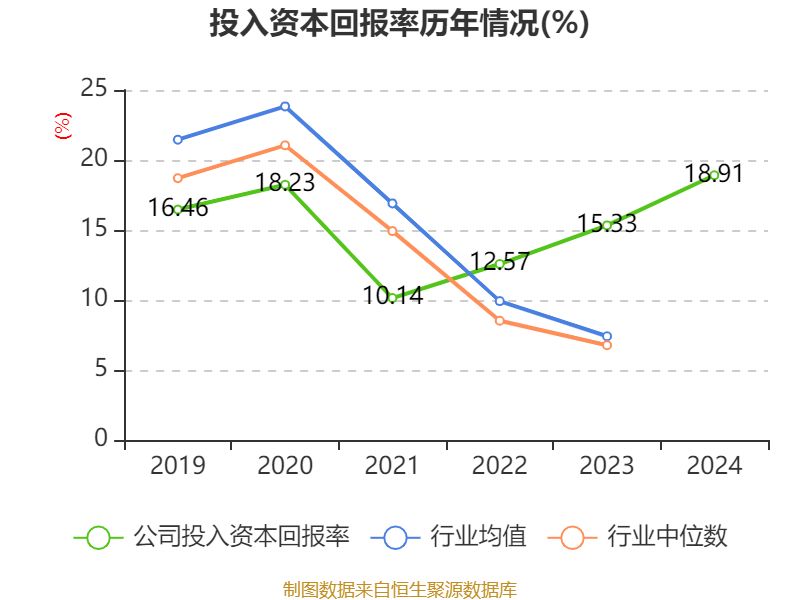
Data shows that in 2024, the company's weighted average return on net assets was 20.01%, an increase of 4.15 percentage points year-on-year. The company's return on invested capital in 2024 was 18.91%, an increase of 3.58 percentage points year-on-year.
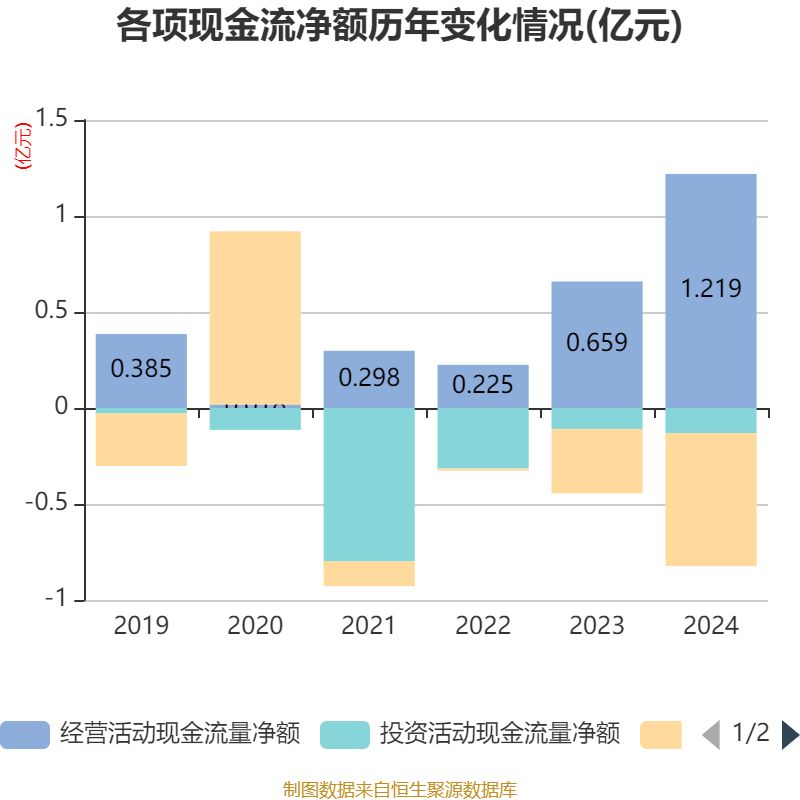
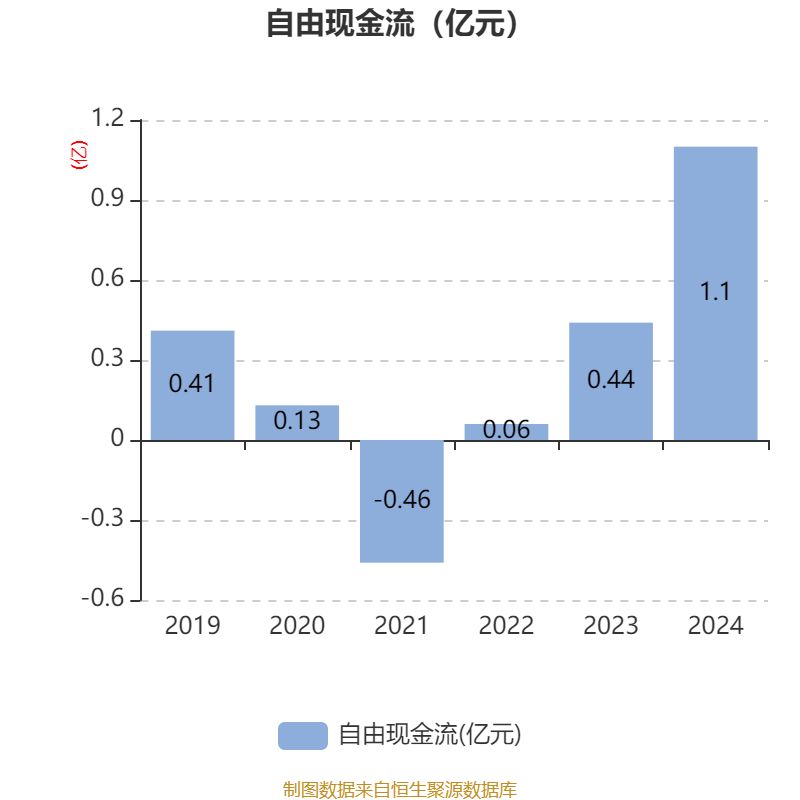
As of 2024, the company's net cash flow from operating activities was 122 million yuan, a year-on-year increase of 84.85%; net cash flow from financing activities was -69.1547 million yuan, a year-on-year decrease of 35.6969 million yuan; net cash flow from investing activities was -13.1087 million yuan, compared with -10.9074 million yuan in the same period of the previous year.
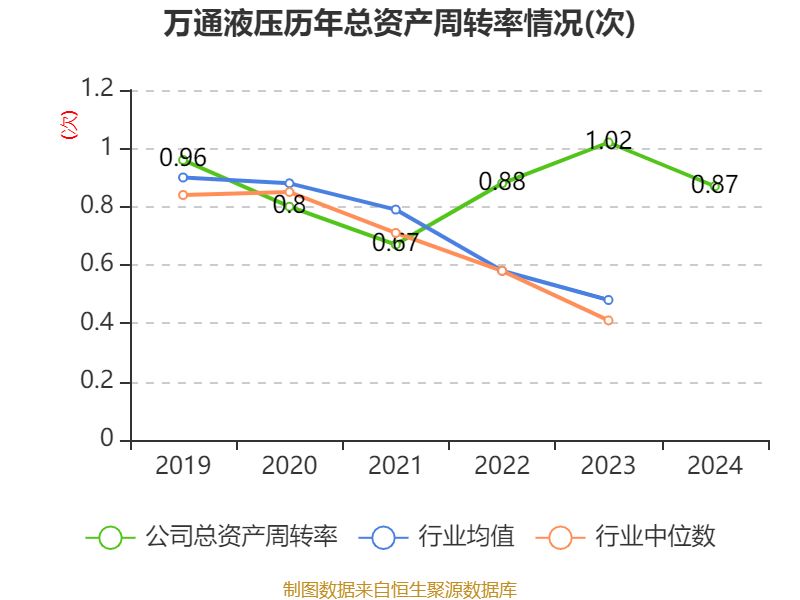
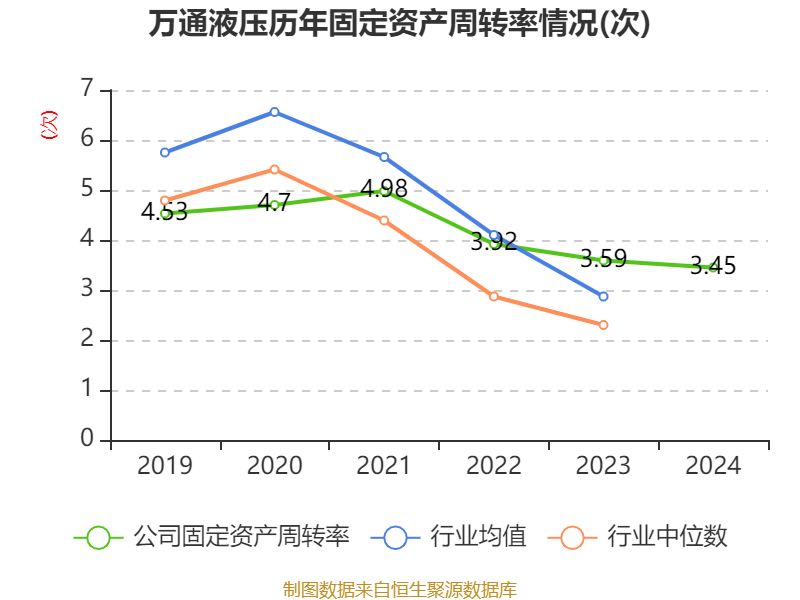
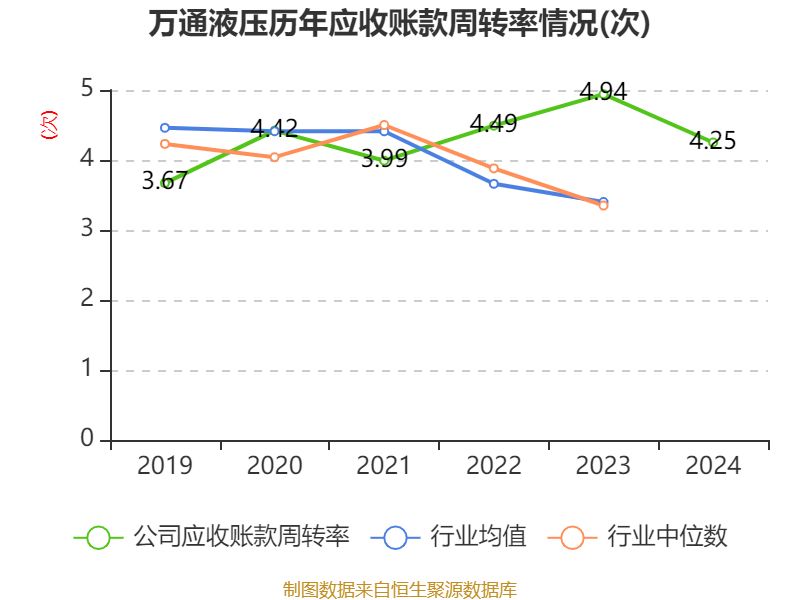
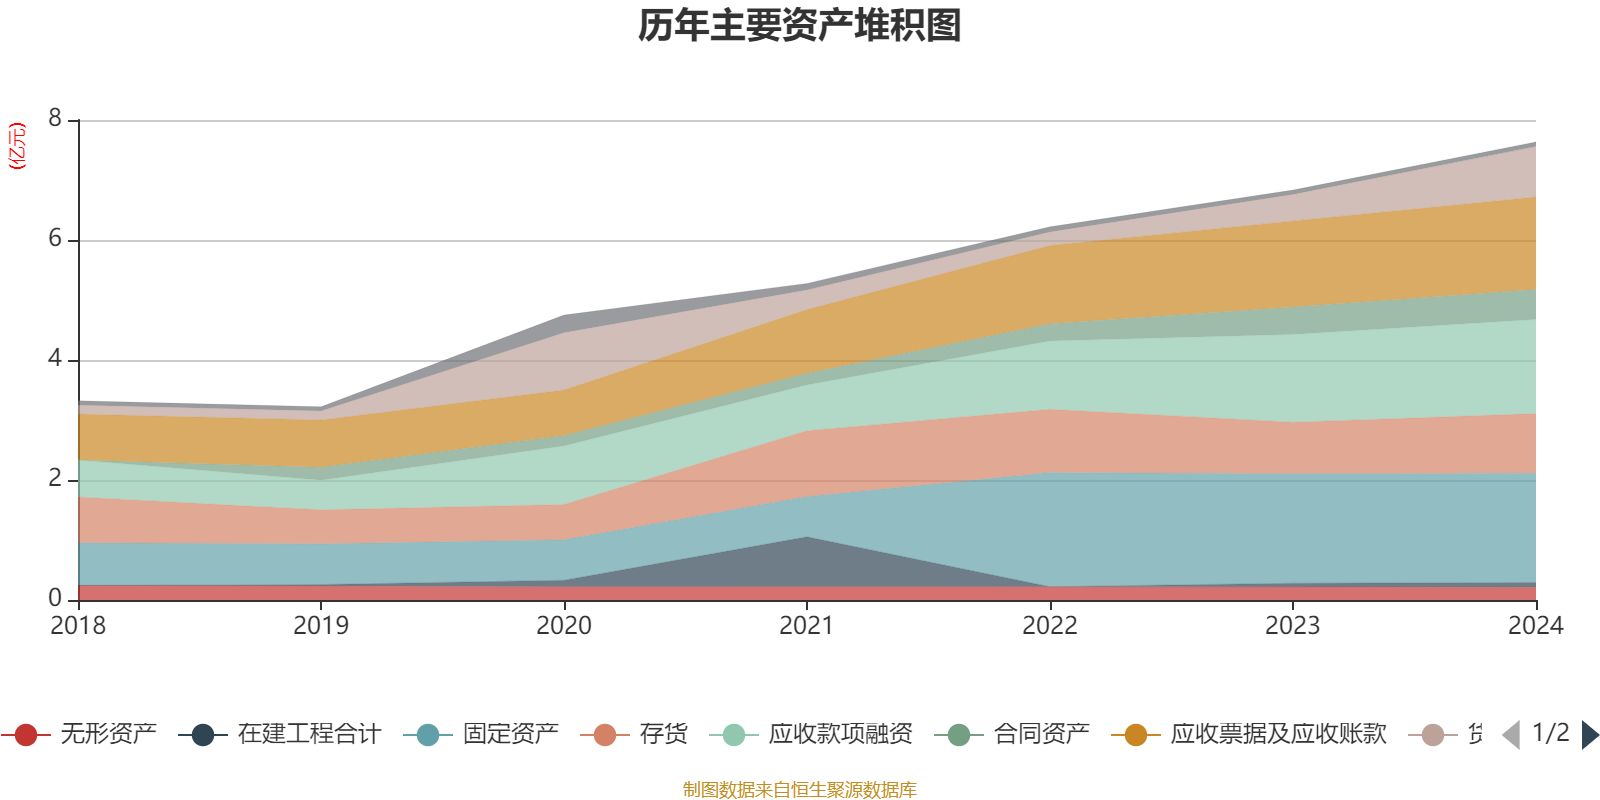
In terms of significant changes in assets, as of the end of 2024, the company's monetary funds increased by 90.21% compared with the end of the previous year, and the proportion of total assets increased by 4.54 percentage points; fixed assets decreased by 0.32% compared with the end of the previous year, and the proportion of total assets decreased by 2.89 percentage points; accounts receivable financing increased by 7.32% compared with the end of the previous year, and the proportion of total assets decreased by 0.85 percentage points; notes and accounts receivable increased by 7.4% compared with the end of the previous year, and the proportion of total assets decreased by 0.82 percentage points.
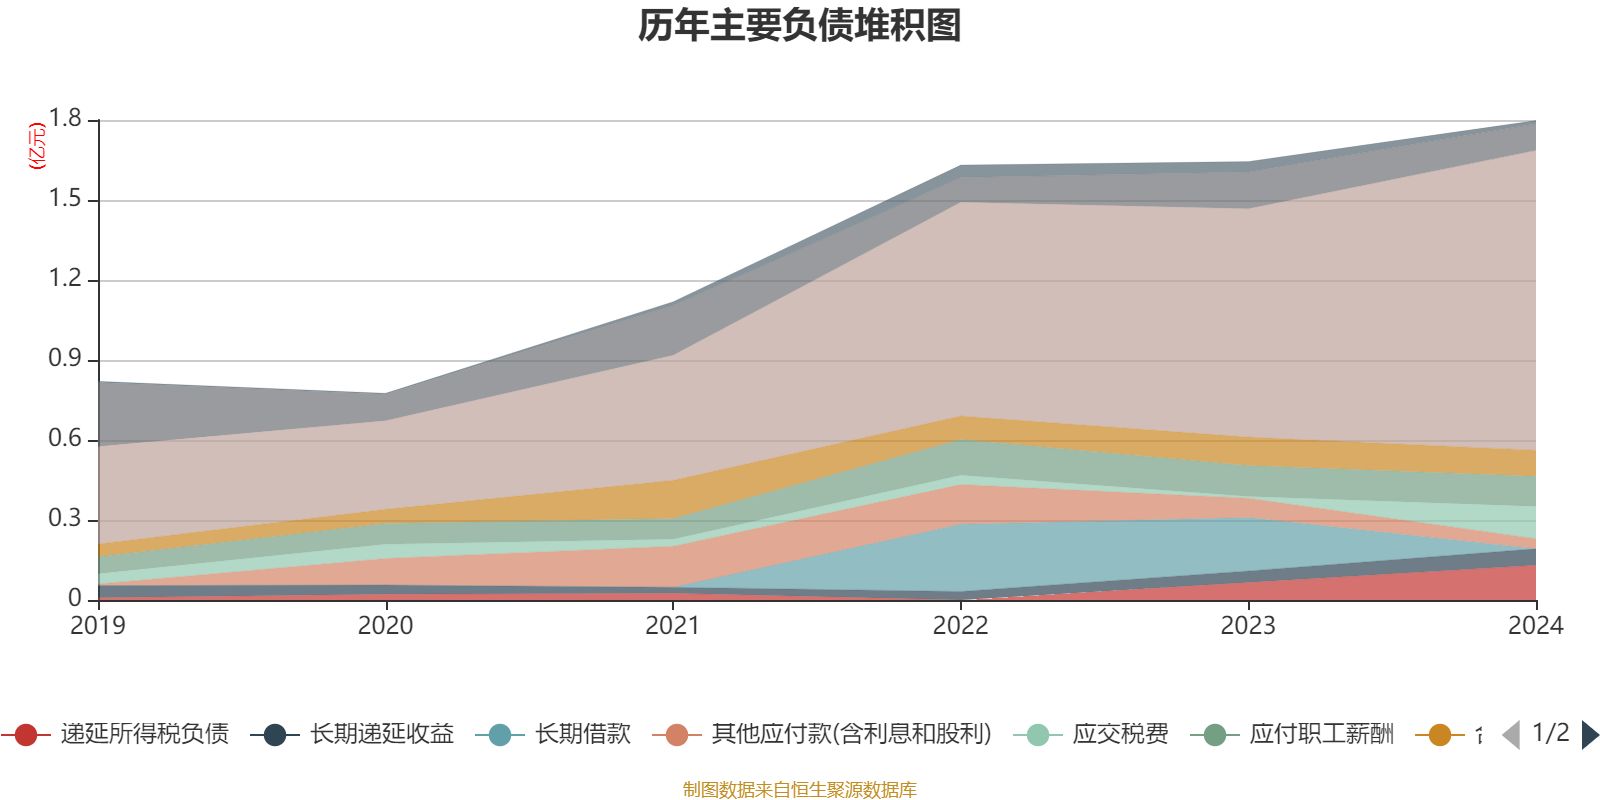
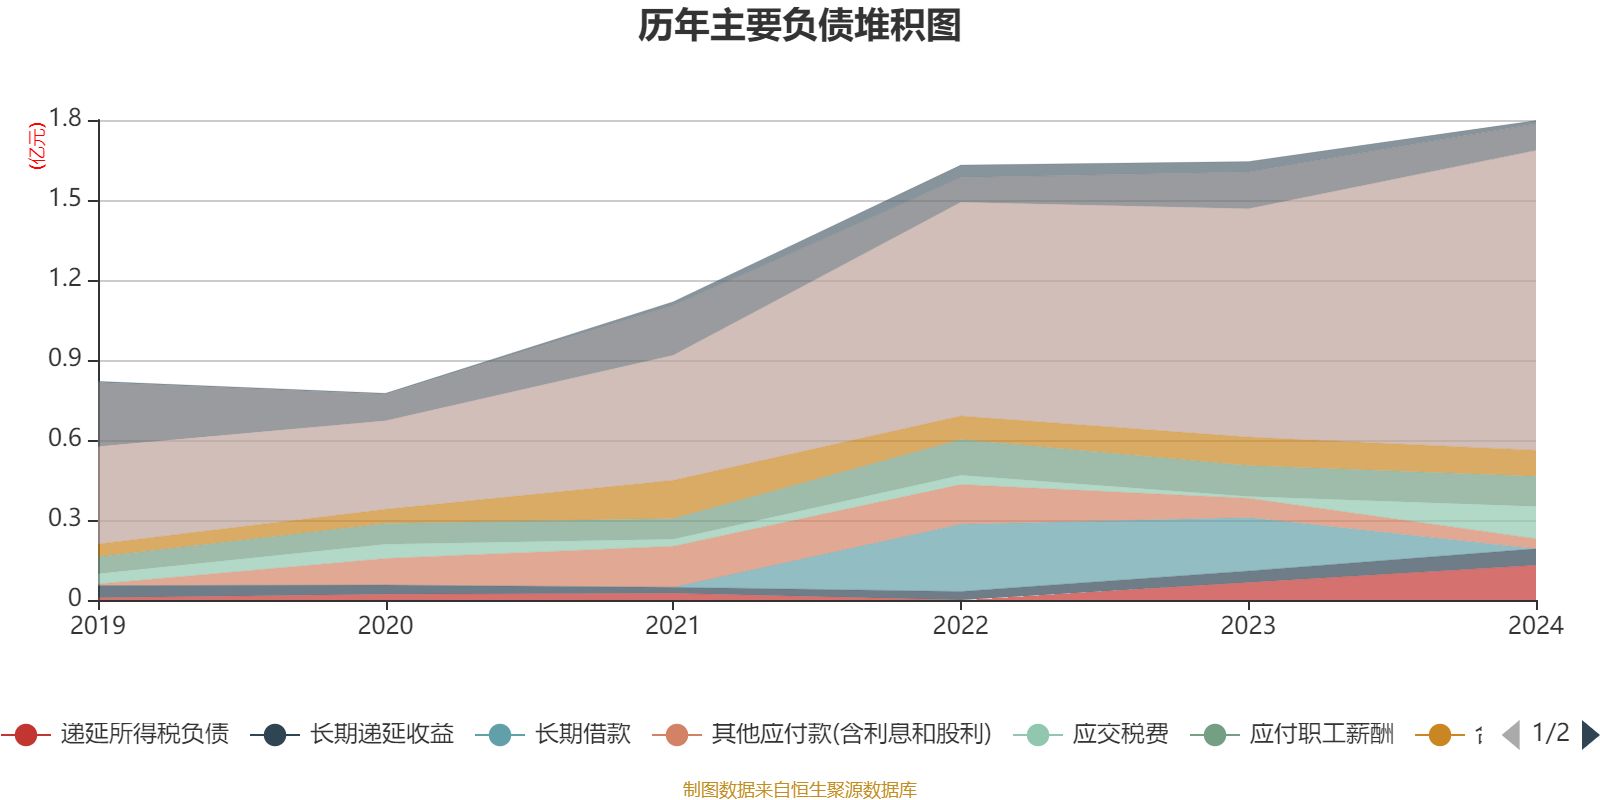
In terms of significant changes in liabilities, as of the end of 2024, the company's long-term loans decreased by 100% compared with the end of the previous year, and the proportion of total assets decreased by 2.93 percentage points; notes and accounts payable increased by 31.34% compared with the end of the previous year, and the proportion of total assets increased by 2.2 percentage points; taxes payable increased by 2087.38% compared with the end of the previous year, and the proportion of total assets increased by 1.51 percentage points; deferred tax liabilities increased by 97.17% compared with the end of the previous year, and the proportion of total assets increased by 0.74 percentage points.
In terms of significant changes in liabilities, as of the end of 2024, the company's long-term loans decreased by 100% compared with the end of the previous year, and the proportion of total assets decreased by 2.93 percentage points; notes and accounts payable increased by 31.34% compared with the end of the previous year, and the proportion of total assets increased by 2.2 percentage points; taxes payable increased by 2087.38% compared with the end of the previous year, and the proportion of total assets increased by 1.51 percentage points; deferred tax liabilities increased by 97.17% compared with the end of the previous year, and the proportion of total assets increased by 0.74 percentage points.
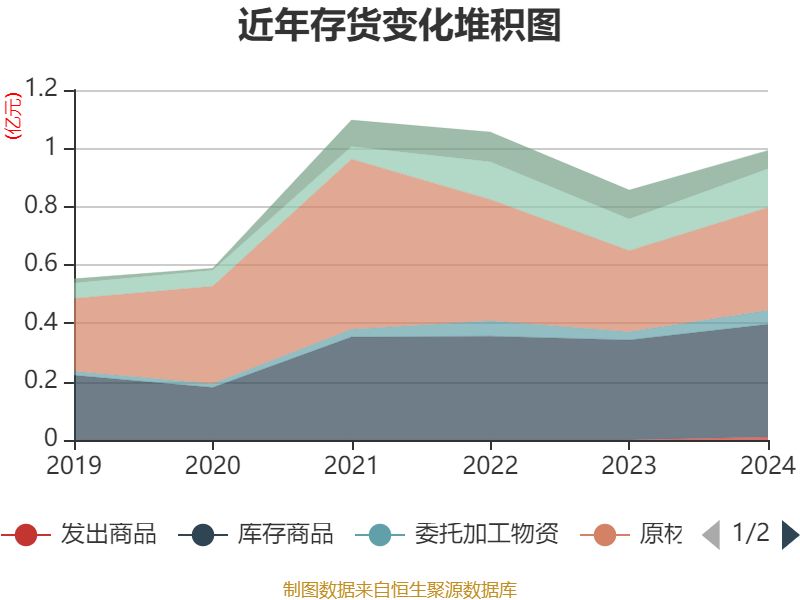
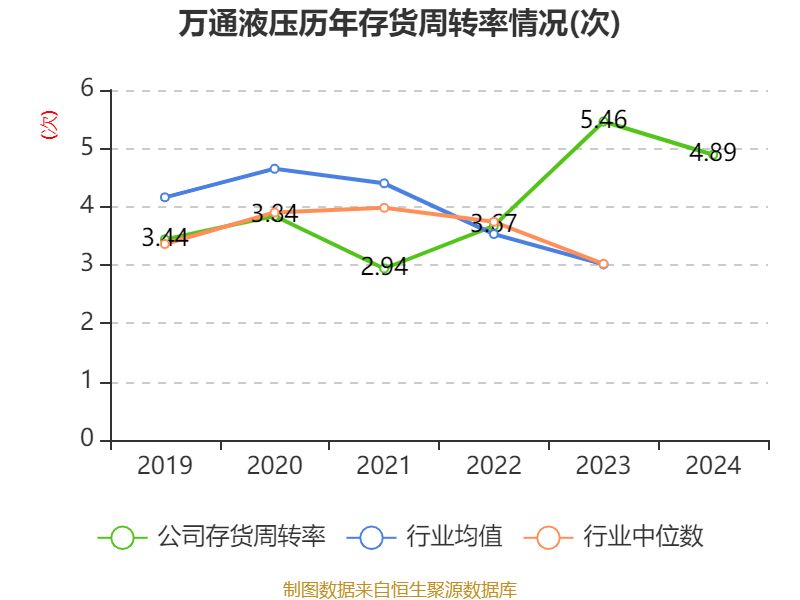
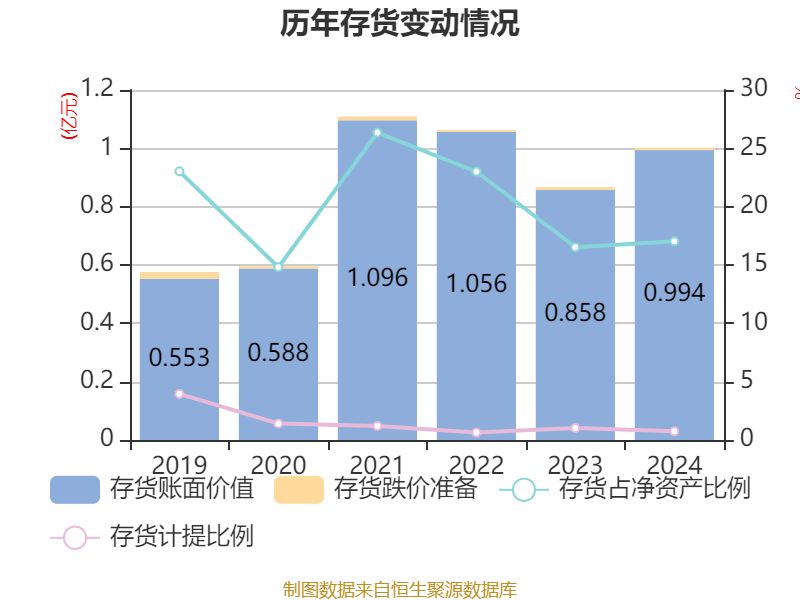
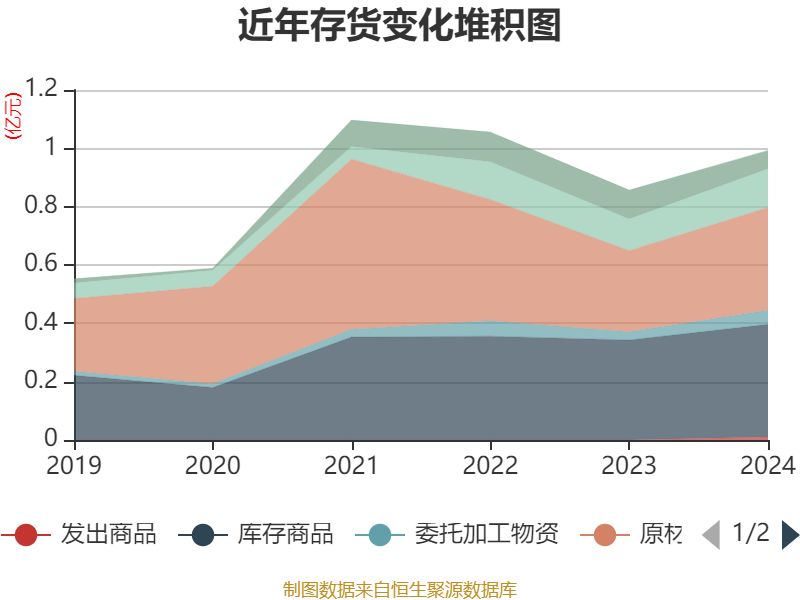
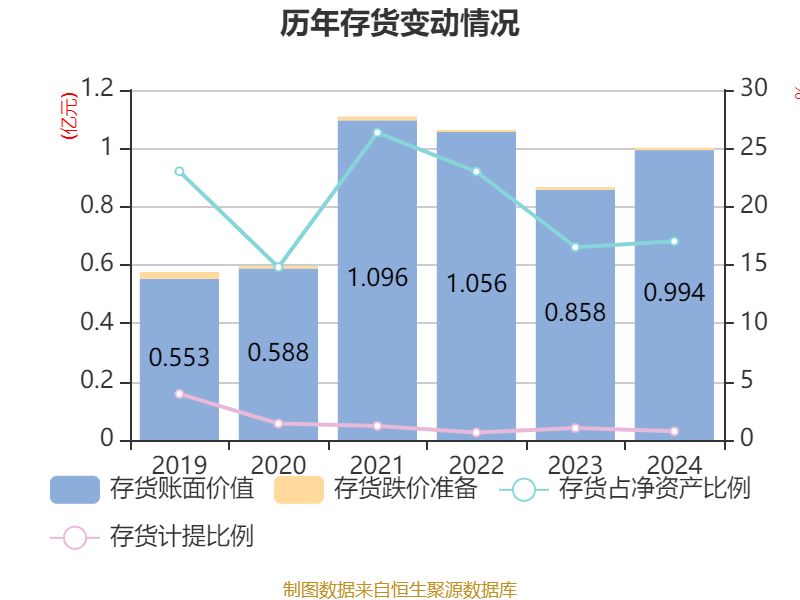
From the perspective of inventory changes, as of the end of 2024, the company's inventory book value was 99.3799 million yuan, accounting for 17.03% of net assets, an increase of 13.6207 million yuan compared with the end of the previous year. Among them, the provision for inventory impairment was 0.7518 million yuan, with a provision ratio of 0.75%.
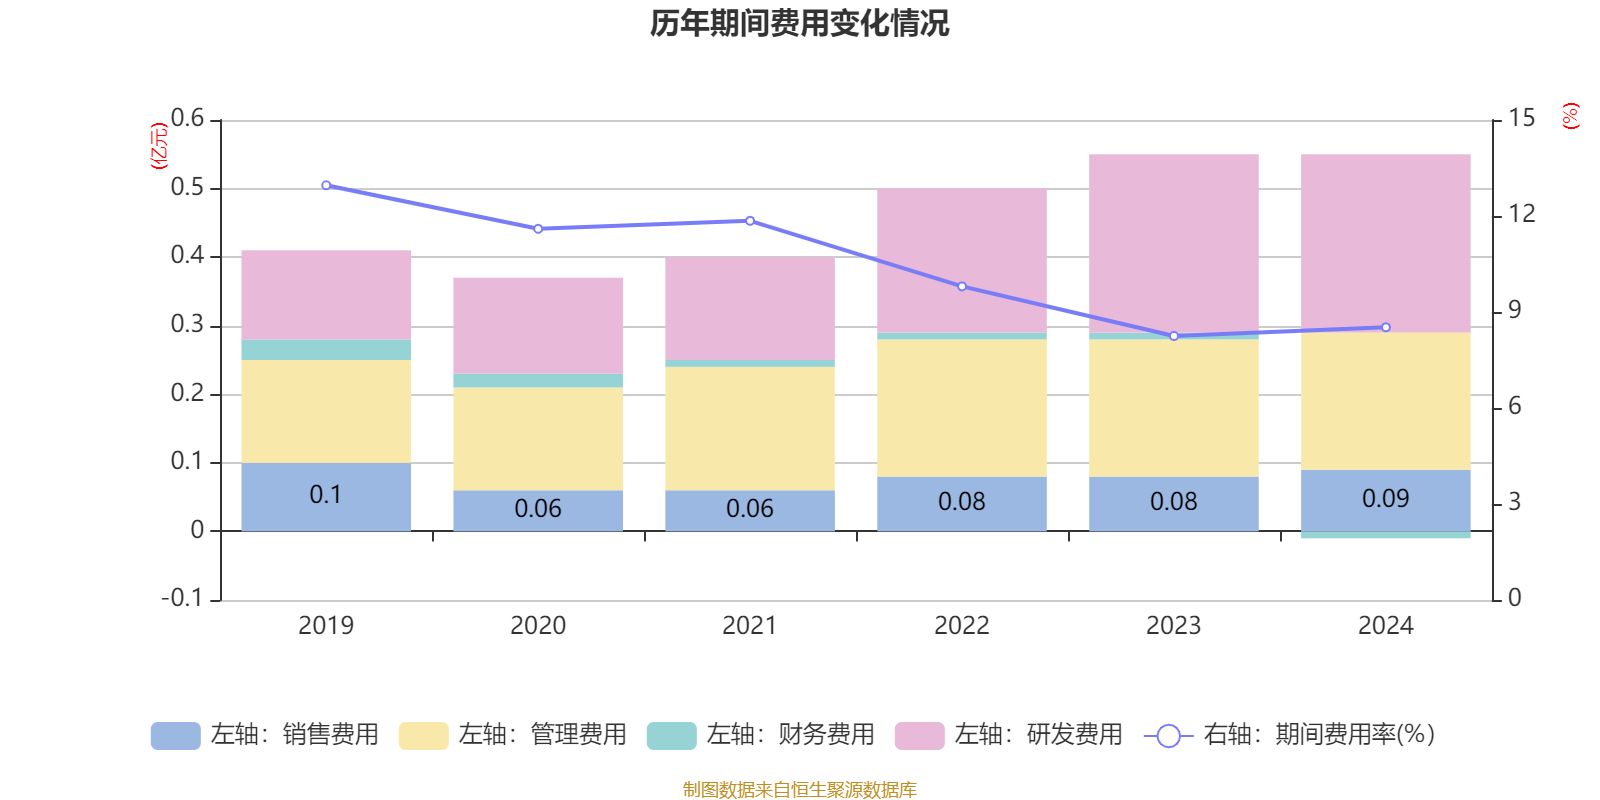
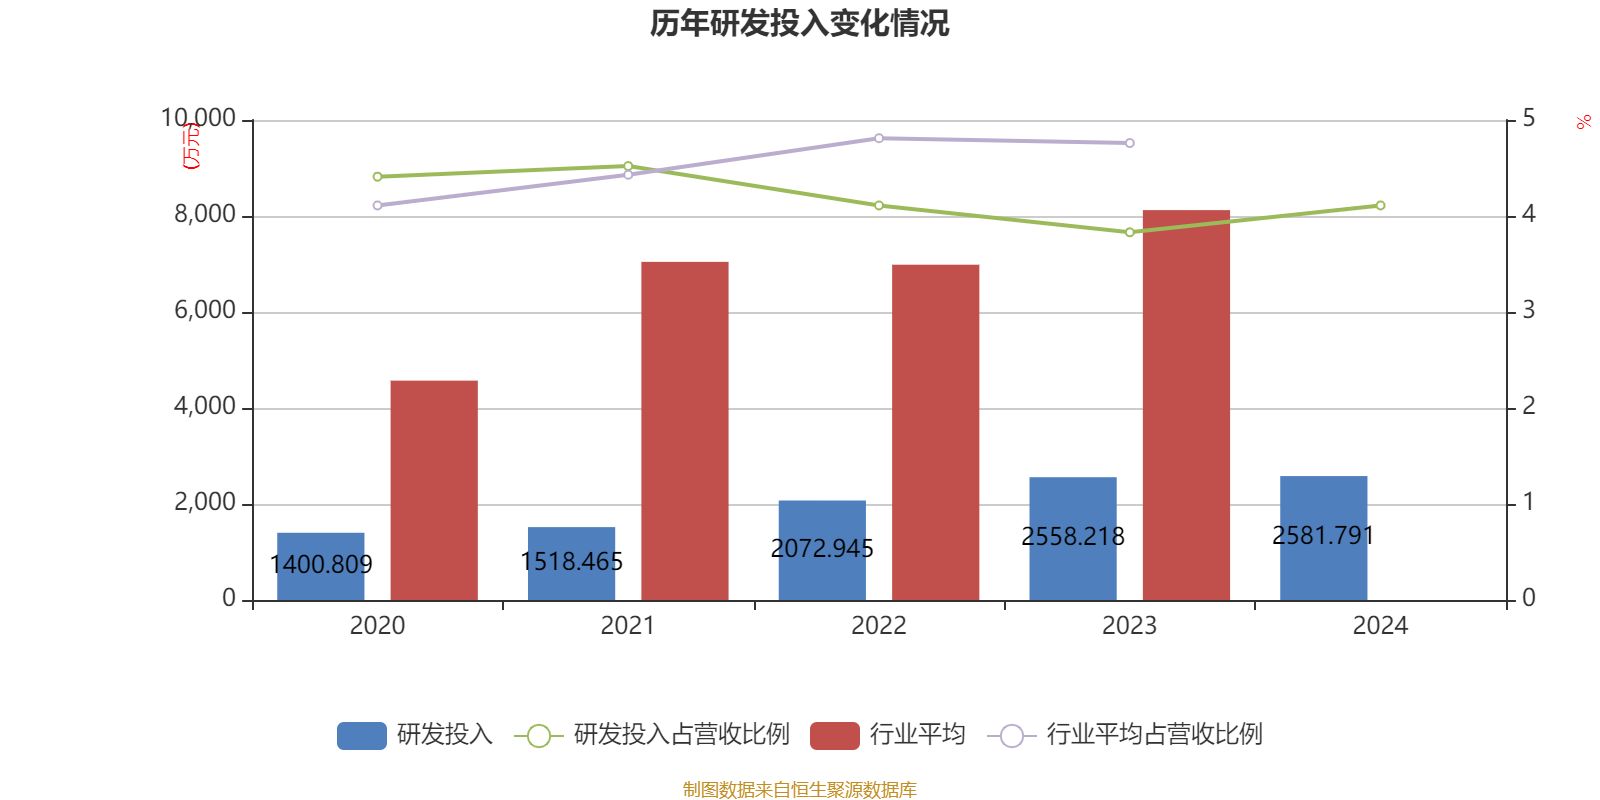
In 2024, the company's research and development investment amounted to 25.8179 million yuan, a year-on-year increase of 0.92%; the ratio of research and development investment to operating revenue was 4.11%, an increase of 0.28 percentage points compared with the same period of the previous year. In addition, the company's annual research and development capitalization rate was 0%.
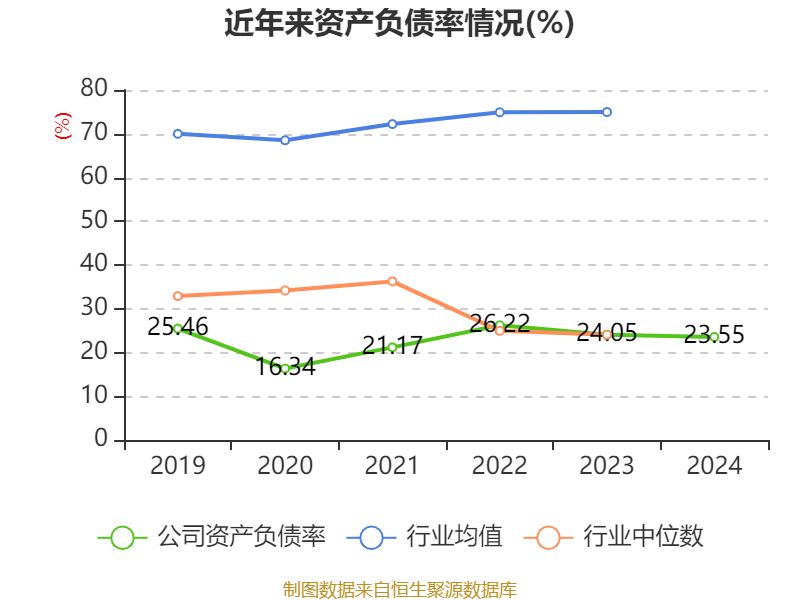
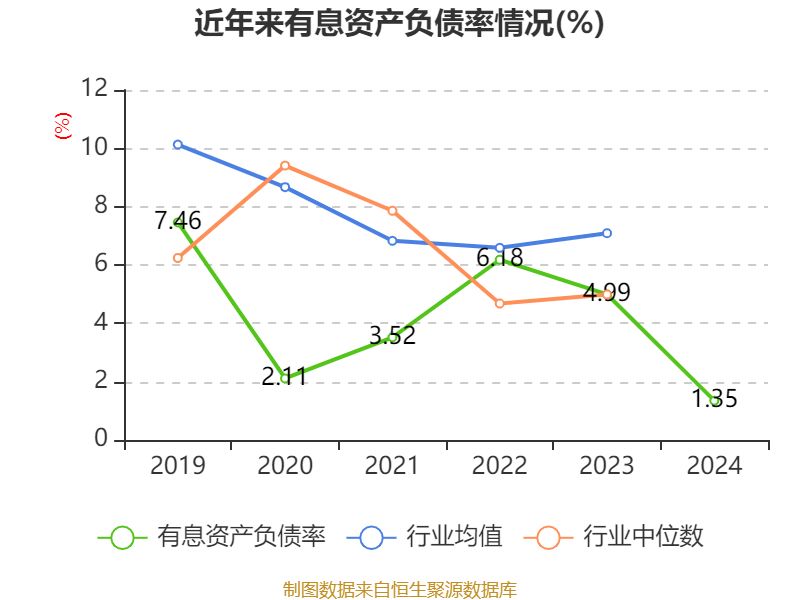
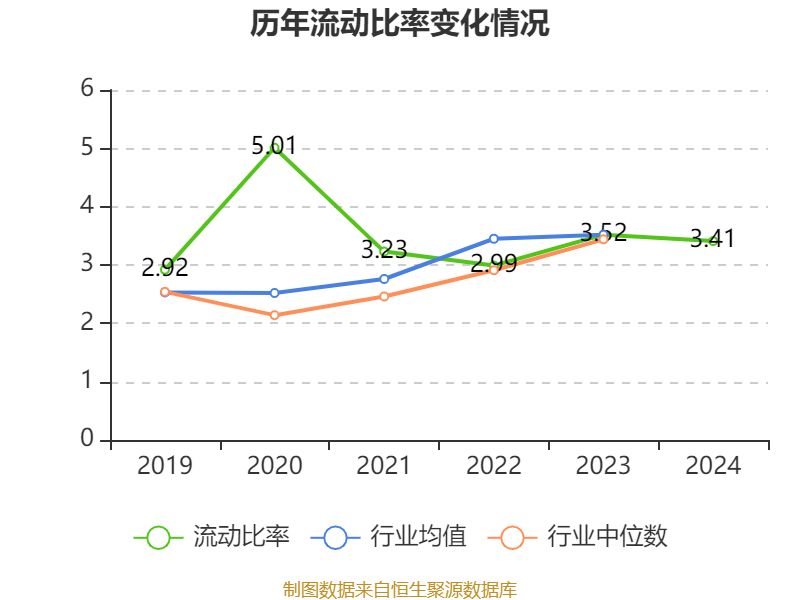
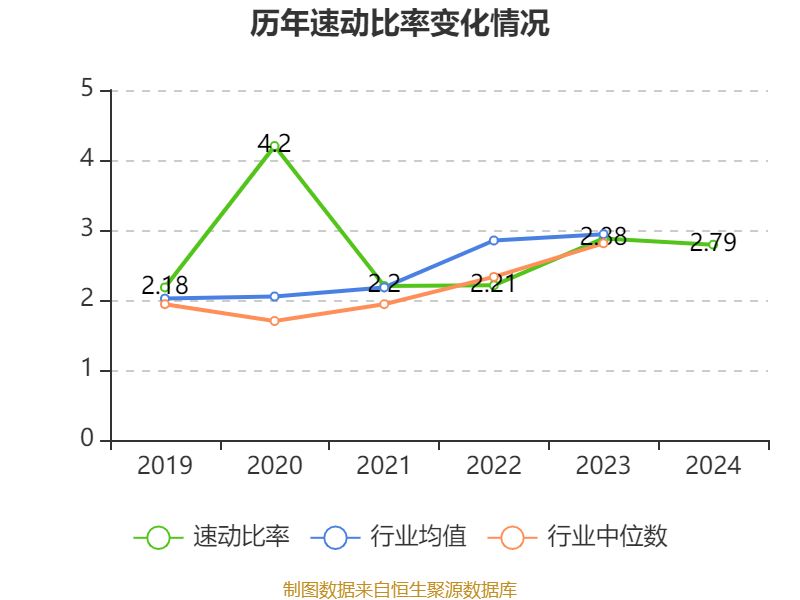
In 2024, the company's current ratio was 3.41, and the quick ratio was 2.79.
The annual report shows that among the company's top ten shareholders at the end of 2024, the new shareholders were Huitianfu BEIJING EXCHANGE Innovation Selection Two-Year Regular Open HybridSecuritiesInvestment Fund, Dacheng BEIJING EXCHANGE Two-Year Regular Open HybridSecuritiesInvestment Fund, replacing the Chengjin Hexin BEIJING EXCHANGE Selection Single Asset Management Plan and Lv Jun at the end of the third quarter. In terms of specific shareholding ratios,Securitiesthe holdings of China Asset Management BEIJING EXCHANGE Innovation Small and Medium-sized Enterprise Selection Two-Year Regular Open Hybrid Initiated
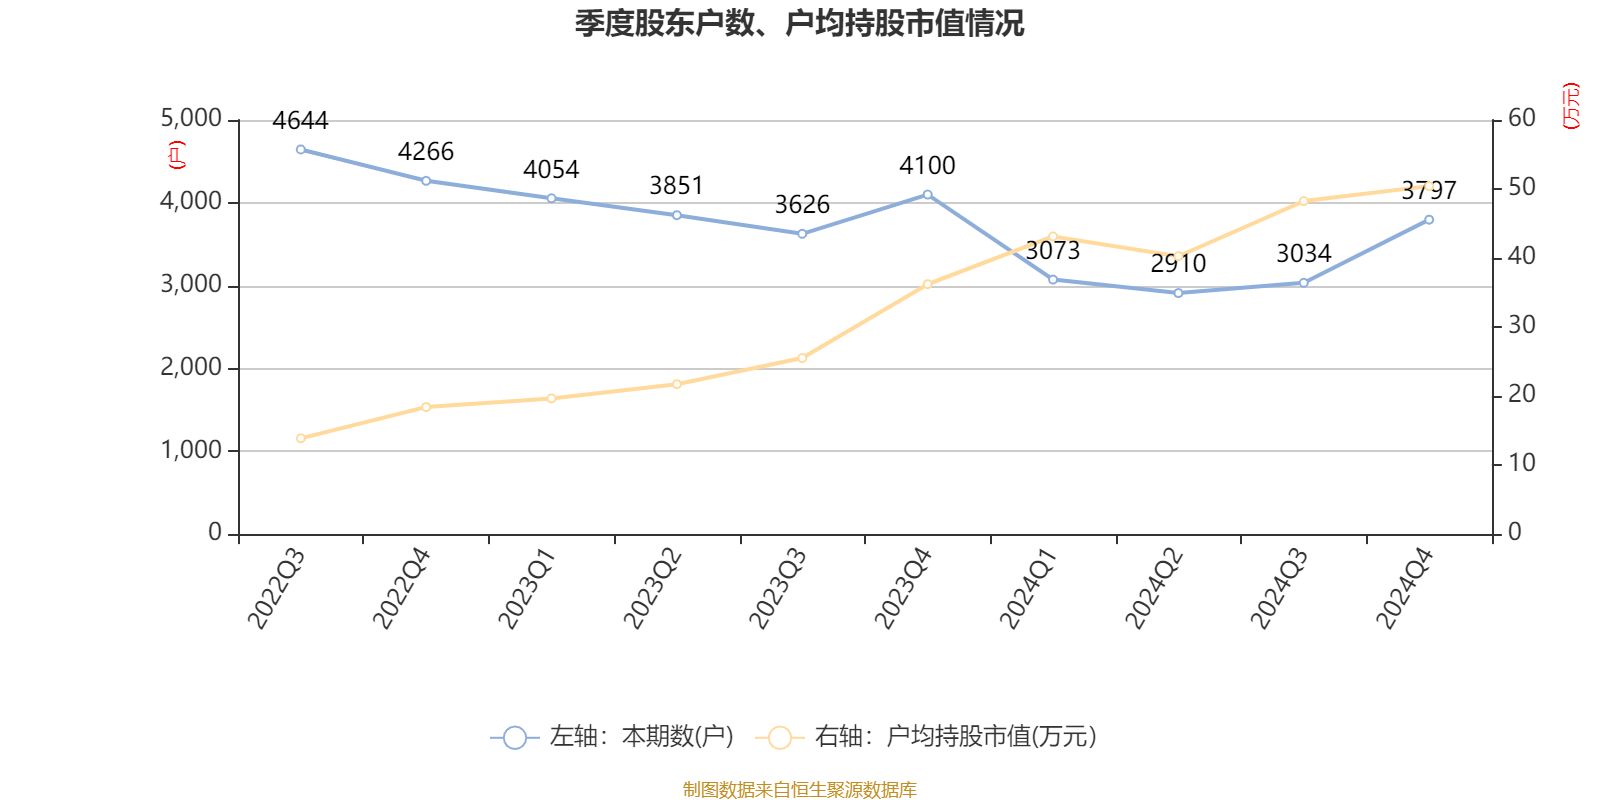
Investment Fund have increased, and Zhang Minna's holdings have decreased.
Indicator Annotation:Price-to-earnings ratio
=Total market capitalization/Net profit. When a company is losing money, the price-to-earnings ratio is negative. In this case, using the price-to-earnings ratio for valuation is meaningless, and the price-to-book ratio or price-to-sales ratio is often used as a reference.Price-to-book ratio
=Total market capitalization/Net assets. The price-to-book ratio valuation method is mainly used for companies with large profit fluctuations and relatively stable net assets.Price-to-sales ratio
=Total market capitalization/Operating revenue. The price-to-sales ratio valuation method is usually used for loss-making or marginally profitable growth companies.
The price-to-earnings ratio and price-to-sales ratio in the text use the TTM method, which is calculated based on the data for the 12 months up to the most recent financial report (including forecasts). The price-to-book ratio uses the LF method, which is calculated based on the data from the most recent financial report. The quantile calculation interval for the three is from the date of the company's listing to the latest announcement date.
When the price-to-earnings ratio and price-to-book ratio are negative, the current quantile is not displayed, which will cause the line chart to be interrupted.



Shandong Wantong Hydraulic Co., Ltd
Address: No.1, Shandong Road, Wulian County, Rizhao City, Shandong Province
24-hour sales hotline: +86 400 900 3958
E-mail: info@wantonghydraulic.com